Friday, January 13, 2017

Droning On - Part 1: Introduction

I'm going to learn how to use a drone - and blog about my journey.

Immersive and interactive media are raising user expectations for a richer and more meaningful visual experience. Images and videos taken with drones are part of this change.

I've just taken delivery of a DJI Mavic Pro drone - or RPA (remotely piloted aircraft).

CASA released updated guidelines for the recreational use of drones/RPAs in Australia late last year.

Just before Christmas Flight safety Australia published Dirty Dozen: 12 ways your drone can land you in trouble so it's not just a matter of unpacking a drone and taking to the skies.

The DJI Mavic Pro at 1.6kg  is classed by CASA as a 'very small RPA (100g - 2kg).
CASA has an eLearning module for the 'sport, recreational or educational' use of 'very small RPAs/drones.

CASA eLearning Module

Now it was time to read the DJI Mavic Pro documentation and unpack the drone.

The DJI Mavic website has a collection of promotional and tutorial videos which were very useful while reading the user manual and unpacking the drone.

Once propellers had been attached  (matching propellers to the correct motor - white circle marks) and the remote controller prepared to was time to charge the batteries.

Attaching propellers and charging batteries
There was plenty of time for more reading and videos while the devices were charging.

Social Technologies Data Flow - Photos and Graphics

Click to enlarge
Photos and graphics is the final topic in this series of data flow / systems diagrams for our Department of Education social technologies services.

Photos and graphics are captured or designed from a wide variety of sources using many devices.

Editing is done through the Adobe Creative Suite for desktop and mobile - plus a wide range of other apps - increasingly on mobile devices.

Photos and graphics are processed, tagged, checked for permission to publish and licensed using the AusGOAL Creative Commons copyright licencing framework.

It is hoped that AI deep learning technology will take over some of the burden of tagging and searching thousands of images in our libraries over the next couple of years (eg automatic image tagging in iPhotos, flickr, Facebook, Google images which has developed rapidly since 2015).

Photos and graphics are published in both traditional media and social media.

Dropbox is frequently used to move digital assets between apps and devices. An increasing number of images are taken and edited on mobile devices and shared to social media.

Different photo libraries are maintained in Adobe Creative Cloud, Dropbox, flickr and Google photos for different purposes and audiences.

Interactive panorama require specialist software and hosting.


This post is part 6 of a series illustrating Data Flow for some Department social technologies:
  1. Social Technologies Data Flow - Facebook
  2. Social Technologies Data Flow - Instagram and Twitter
  3. Social Technologies Data Flow - Google+
  4. Social Technologies Data Flow - Video
  5. Social Technologies Data Flow - Mobile Apps
  6. Social Technologies Data Flow - Photos/Graphics


Monday, January 9, 2017

Social Technologies Data Flow - Mobile Apps

Click to enlarge

Most mobile app production is as an HTML5 'web-app'.

iSpring is used as a 'rapid development tool' to output HTML5 from PowerPoint. HTML5 files are hosted at SiteGround and are accessible from all mobile devices. Apps can also be a accessed via the iSpring native mobile app and for off-line viewing.

A WordPress Native app plugin has also been used and in some cases HTML5 files are produced by external contractors.

There is some use of Schoolzine for online newsletters which may be accessed directly or via the Schoolzine native mobile app.


This post is part 5 of a series illustrating Data Flow for some Department social technologies:
  1. Social Technologies Data Flow - Facebook
  2. Social Technologies Data Flow - Instagram and Twitter
  3. Social Technologies Data Flow - Google+
  4. Social Technologies Data Flow - Video
  5. Social Technologies Data Flow - Mobile Apps
  6. Social Technologies Data Flow - Photos/Graphics

Sunday, January 8, 2017

One Drive ate up my NBN allowance

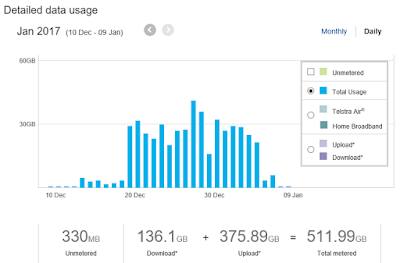
A few days ago I got a message from my telco (Telstra) that I had exceeded my 500GB monthly NBN allowance - not something I ever expected to happen. 

Several hours later my learning can be summarised as follows:
  • Pay attention to notices from my telco - I got an 85% warning a few days earlier
  • Having your NBN speed lowered to 256kbps focusses the mind
  • My telco has very useful NBN analytics
  • Windows 10 has a useful Data Usage tab
  • One Drive needs to be carefully configured
  • My telco has much improved customer service
  • I probably don't need a 500GB monthly data allowance - it was a special NBN deal  :-)
The following NBN data usage analytics from my telco clearly showed a dramatic change on 20 Dec 2016 and that uploads were the principal problem.
Click to enlarge

Consulting Google I learned that Windows 10 Settings --> Data Usage can be very helpful.
Windows desktop data usage for the last 30 days was 397GB!


Usage details for the last 30 days on my Windows desktop led to:


A similar situation was found on my Windows 10 laptop.
I use Dropbox extensively and hardly use One Drive at all - or so I thought...

My response - possibly an over-reaction - was to unlink One Drive for home and work and not use it again until it behaves itself.

My telco generously allows 3 monthly allowance resets a year so once I had found the problem I initiated one. I was also able to use fast call back (no phone queues) to cancel my data usage inquiry after logging the issue with tech support. I got a call back in 2 mins - exceptional service.

I have no idea what happened on 20 December to trigger the poor One Drive behaviour but it won't impact my NBN allowance again  :-)

As you can see all back to normal now:

Click to enlarge


Friday, January 6, 2017

Social Technologies Data Flow - Video

Click graphic to enlarge

The production and viewing of video content has increased in volume and complexity across the Department over the last 3 years. Offline and online HD video is captured through a range of devices including mobile devices and web cams. This creates large (100's GB) files that need to be moved, stored, shared and processed.

External contractors produce some video which is usually shared during production using Dropbox and Vimeo. Finished products are generally uploaded (MP4) to Vimeo or YouTube.

In-house production of short clips for social media channels is increasingly done on mobile devices using a range of video apps such as iMovie. Longer videos are edited using Camtasia Studio on desktops. Geographically dispersed production teams share video files (MP4) via Dropbox and Vimeo.

Vimeo is used to provide a library of Department stock video for use in future productions.

Creative Commons background music and sound effects are generally used and the final video is generally uploaded as Creative Commons BY 4.0 specifying any exceptions such as logos or partner content.

The Amara captioning service linked to Vimeo is often used to produce SRT files that are uploaded to Vimeo or YouTube after editing. Sometimes captions are burnt into the video using Camtasia Studio.

Some videos are uploaded to Facebook rather than share a link from YouTube.

Panopto is used to produce screen casts. Screencasts are also produced using the Camtasia Studio PowerPoint add-in which then allows advanced features to be added. Video can also be exported from Panopto to Camtasia Studio for advanced editing.

uQR.me is used to generate and manage dynamic QR codes to link to videos from printed resources or from labels on objects in learning environments.

2017 challenges
  • Live video casting from Facebook, Twitter and other services is increasing. We will need to consider best practice information management procedures.
  • Longer videos require greater processing power. SSD technology is being considered for 2017.
  • Terabytes of video archives are currently stored in external hard drives across the organisation. These need to be better managed.


This post is part 4 of a series illustrating Data Flow for some Department social technologies:
  1. Social Technologies Data Flow - Facebook
  2. Social Technologies Data Flow - Instagram and Twitter
  3. Social Technologies Data Flow - Google+
  4. Social Technologies Data Flow - Video
  5. Social Technologies Data Flow - Mobile Apps
  6. Social Technologies Data Flow - Photos/Graphics

Thursday, January 5, 2017

Social Technologies Data Flow - Google +

Click graphic to enlarge

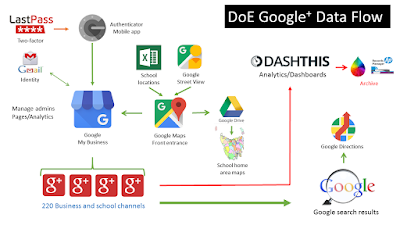
The Google search engine prioritises Google+ content if it exists. The Department has created Google+ pages for all schools so that key information such as contact, phone, hours, web sites and branded photos appear in search results. As you can see from the 2016 data below there was significant engagement with the Google+ content appearing in Google search results.
Click graphic to enlarge

Google My Business is used to manage our 220 Google+ pages and GPS locations were uploaded via a CSV file. In 2017 we plan to add some 360 photos via the Google Street View mobile app to assist users to find school offices and other key facilities.

Google Maps and Google My Maps are used to add map layers and additional content which are saved in Google Drive - as well as providing direction to events and planning itineraries.

2017 challenges:

A few schools customise their Google+ page and this is expected to increase during 2017. For this reason we are now planning to supplement Google+ Insights with analytics from DashThis. We will also begin to archive Google+ pages during 2017 using Digi.me.


This post is part 3 of a series illustrating Data Flow for some Department social technologies:
  1. Social Technologies Data Flow - Facebook
  2. Social Technologies Data Flow - Instagram and Twitter
  3. Social Technologies Data Flow - Google+
  4. Social Technologies Data Flow - Video
  5. Social Technologies Data Flow - Mobile Apps
  6. Social Technologies Data Flow - Photos/Graphics


Wednesday, January 4, 2017

Social Technologies Data Flow - Twitter and Instagram

Click graphic to enlarge

The data flow diagrams or system maps for the Department's Instagram and Twitter channels are similar to that of Facebook shown in the previous post - although the audiences and number of instances for both are currently much smaller.

Click graphic to enlarge
As before LastPass, two-factor authentication and Google Authenticator are used to manage the security of social media services.

Google Alerts and Hootsuite are used to track key hashtags and mentions. Hootsuite is used during live events.

Both the Instagram and Twitter mobile apps are used and these are signed into multiple accounts making it quick to monitor and share posts across accounts.

The Department's main Instagram is linked to the main Facebook account and Facebook Business Manager for Insights, advertising and invoicing.

Repost It! is used to share Instagram posts. InsTrack has some analytics to complement Instagram Insights and reports on gained and lost Instagram followers.

DashThis and Digi.me are used for reporting analytics, live display (in 2017) and archiving as described in the previous post.

2017 challenges in this area are:
  • keeping up with the increase in Instagram accounts across the Department
  • reaching a larger employee Twitter audience during live events such as conferences and workshops (approx. 25% of employees have signed up to Twitter)
  • integrating Instagram and Twitter with the Department's Yammer presence.


This post is part 2 of a series illustrating Data Flow for some Department social technologies:
  1. Social Technologies Data Flow - Facebook
  2. Social Technologies Data Flow - Instagram and Twitter
  3. Social Technologies Data Flow - Google+
  4. Social Technologies Data Flow - Video
  5. Social Technologies Data Flow - Mobile Apps
  6. Social Technologies Data Flow - Photos/Graphics

Social Technologies Data Flow - 270 Facebook Pages

Click to open larger graphic

I've been updating the data flow or systems mapping for the Department's current social technologies.
This map shows the services and dependencies used to manage information across our official Facebook pages. The Department has around 270 official Facebook pages and post impressions range from 2-4 million per month. (See graphic at the end of this post.)

LastPass has being introduced to manage social media passwords and two-factor authentication is on for all services. Facebook admins access official pages through their own accounts (with a couple of exceptions) and Facebook Business Manager is used to manage assets, people and advertising. Google accounts and Google Authenticator are used for access/authentication to most social media services.

Hootsuite is used a little but increasingly Facebook admins prefer to visit pages individually via a desktop browser or the Facebook Pages Manager mobile app. Hootsuite is also used less than in the past for posting to multiple channels - posts are generally rewritten for different audiences and services. Hootsuite is used to monitor tags and mentions.

Facebook posts are shared between Department pages and from partner and various community pages. Longer posts are written in Blogger (or other Open Graph blogs) and then shared back to Facebook pages. Blogger is also used for the Department's Social Media Directory. Blogger is regularly backed up to XML for business continuity and PDF pages are saved for archiving.

DashThis analytics is used to complement Facebook Insights and connects to all Facebook pages via the Facebook Business Manager. We are currently investigating the use of DashThis and a few other services to display social media dashboards in the office and at events.

Digi.Me is used to archive selected official Facebook pages for reporting and storing (as PDFs) in the Department's Records Manager (HPRM).

Some challenges in this area for 2017 are:
  • To archive more Facebook pages - an increasing proportion of content is only available on Facebook pages and not just shared from other online sources such as websites.
  • To move the remaining Facebook open groups to pages - Facebook groups have no analytics or archiving.
  • To customise Facebook pages and develop some Facebook apps
As the following graphic shows Facebook use across the Department continues to rise.

Click graphic to enlarge


This post is part 1 of a series illustrating Data Flow for some Department social technologies:
  1. Social Technologies Data Flow - Facebook
  2. Social Technologies Data Flow - Instagram and Twitter
  3. Social Technologies Data Flow - Google+
  4. Social Technologies Data Flow - Video
  5. Social Technologies Data Flow - Mobile Apps
  6. Social Technologies Data Flow - Photos/Graphics